JAN 11, 2025
1,516 words
3 m
🌍 Dashboarding the world:
interactive data and analytics
A responsive dashboard to monitor live session while they're happening
In the fast-moving landscape of identity verification, real-time insight is essential. At Didit, a fully responsive dashboard was created to monitor live identity sessions around the globe while providing aggregated business metrics tailored for operational oversight.
Visualizing global activity
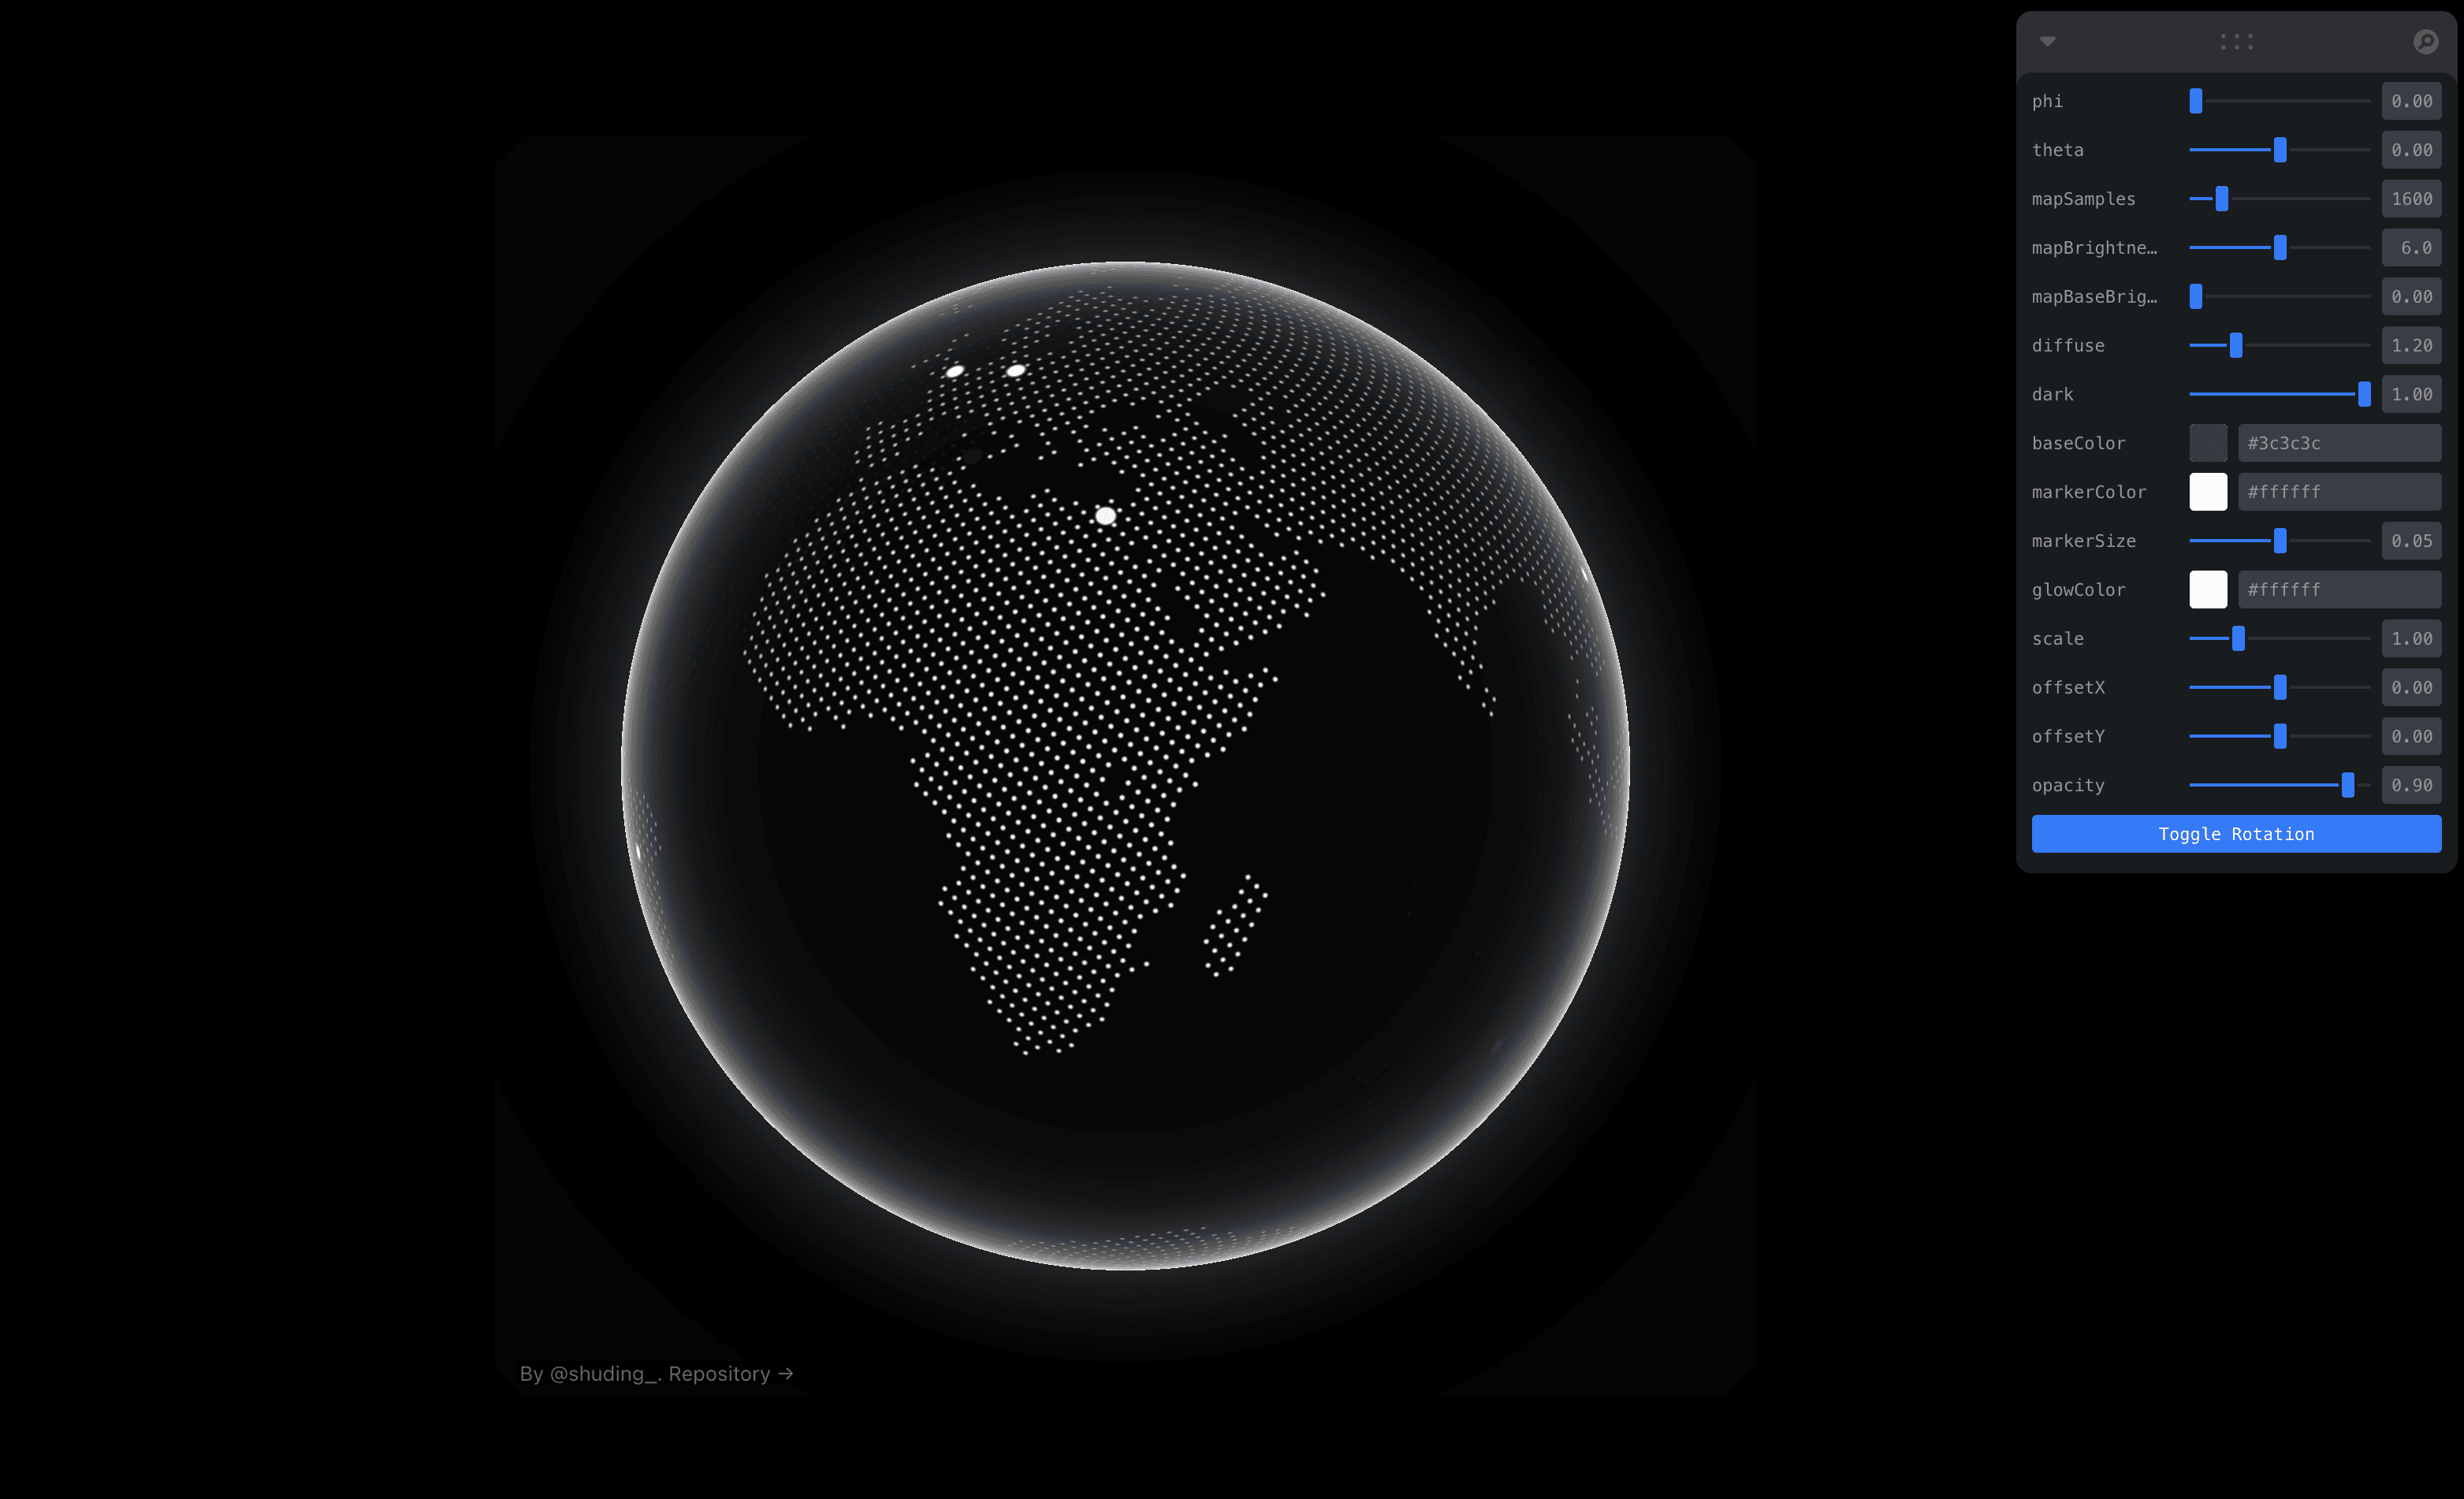
A standout element is the interactive 3D globe, powered by the Cobe library, which visualizes session activity in real time. This globe acts as the visual anchor of the dashboard, turning abstract data into a living, spatial experience that highlights geographic patterns at a glance.
Custom themes and visual flexibility
The visual system was designed to support dynamic theming, allowing different color palettes to be applied based on brand, environment, or customer preferences. This feature ensures scalability with the evolving of the products offered by Didit as a digital identity provider.
Bringing data to life: dashboards for real life workspaces
Designed with physical workspaces in mind, the dashboard seamlessly adapts to large-scale formats such as wall-mounted TV screens, office-wide projections, and display panels. Its responsive layout ensures that data remains clear, engaging, and accessible whether viewed on a desktop or displayed across a full-width screen in a live operations room.
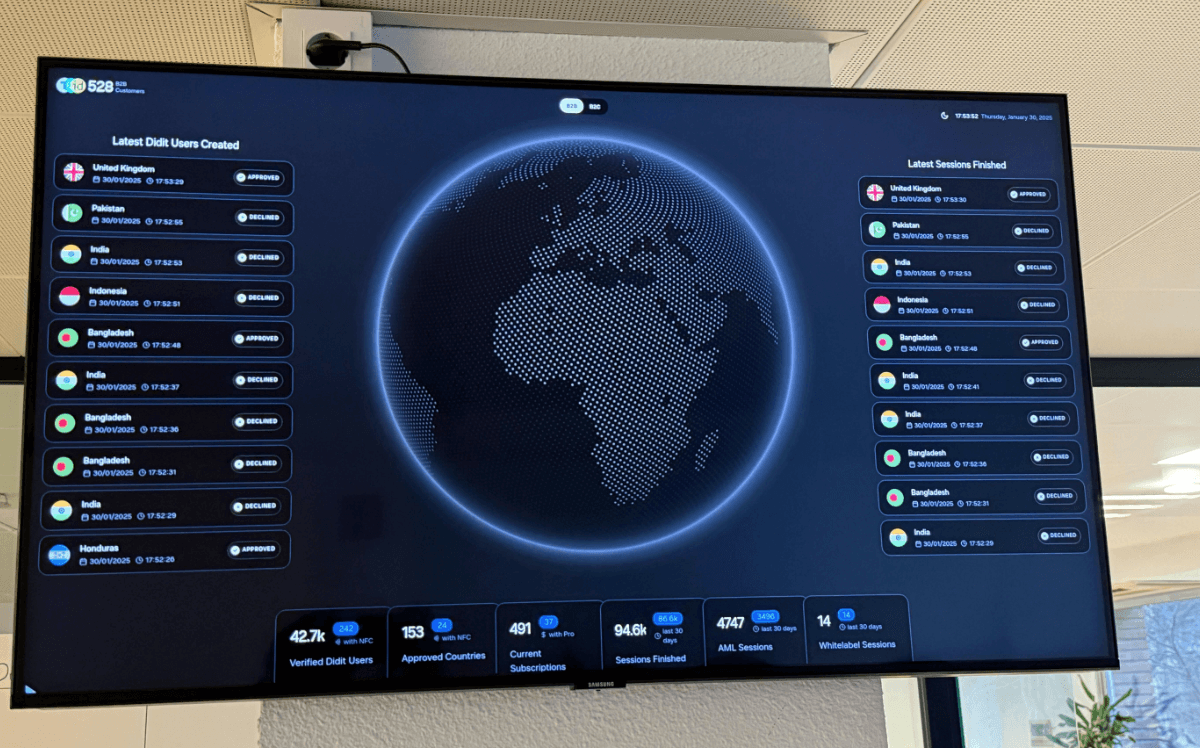
The dashboard added a dynamic presence to the office, turning real-time data into something visible and engaging. New customer sign-ups, KPIs reached, or key sessions completed could be tracked instantly, brining the company milestones into the daily workspace.